The Unofficial Communications/Navigation Outage Forecast System Satellite data page
This is the home of various C/NOFS related data products.
Terms of use: Use of the data provided through this website comes with the understanding that all data providers will be given credit for there work, that they will be notified that their data is being used, and that they will be allowed to collaborate on that work.
To be granted authorization to use the data contact the site administrator: roddy.patrick[at]yahoo.com
PLP figures through September 2012 are now up (NEW! as of 11/5/12)
All the 1 Hz data and figures are now available in their respective directories.
C/NOFS Publication List (NEW!)
Here is a list of C/NOFS related publications as of 1 February 2012 with abstracts.
PLP data availability
To check on what days there is PLP data available use the files for 2011 and for 2008-2010. The length and color of the bar on a given day indicates how much of the data we have available. If there is no data available on a given day it may exist and I can can attempt to patch that day if you really want that data.
Handbook of Geophysics and the Space Environment, 1985
The 1985 AFRL Handbook of Geophysics and the Space Environment is available here. I couldn't find any copyright information in the book so I'm assuming that it's free to distribute.
News
December 2011: Scientists with team VEFI have used C/NOFS data to show that the Schumann resonance is detectable above the F peak of the ionosphere. This story was big enough to make it onto slashdot.org so it must be big! Link
18 March 2011: There's an op-ed in the New York Times written by John P. Holdren and John Beddington, science advisers to president Obama and Prime Minister David Cameron, respectively, about the importance of space weather forecasting. Go read it before the NYT puts up another paywall.
16 March 2011: Amazing video of the destructive power of space debris. Holger Krag at Esa's Space Debris Office – which monitors more than 16,000 bits of junk in Earth orbit – explains how manned spacecraft are shielded
10 March 2011: The Royal Academy of Engineering publishes the report Global Navigation Space Systems: reliance and vulnerabilities which apparently documents how we have become too reliant on space based navigation systems for everything. The document is hosted here for the benefit of those who cannot browse foreign websites.
6 March 2011: An article in New Scientist on cheap GPS jammers, spoofers other horrors.
PLP summary plots
Yes, the PLP summary plots for 2008-2010 are going up and are available in bundles of 1 month .zip files.
Plot description:
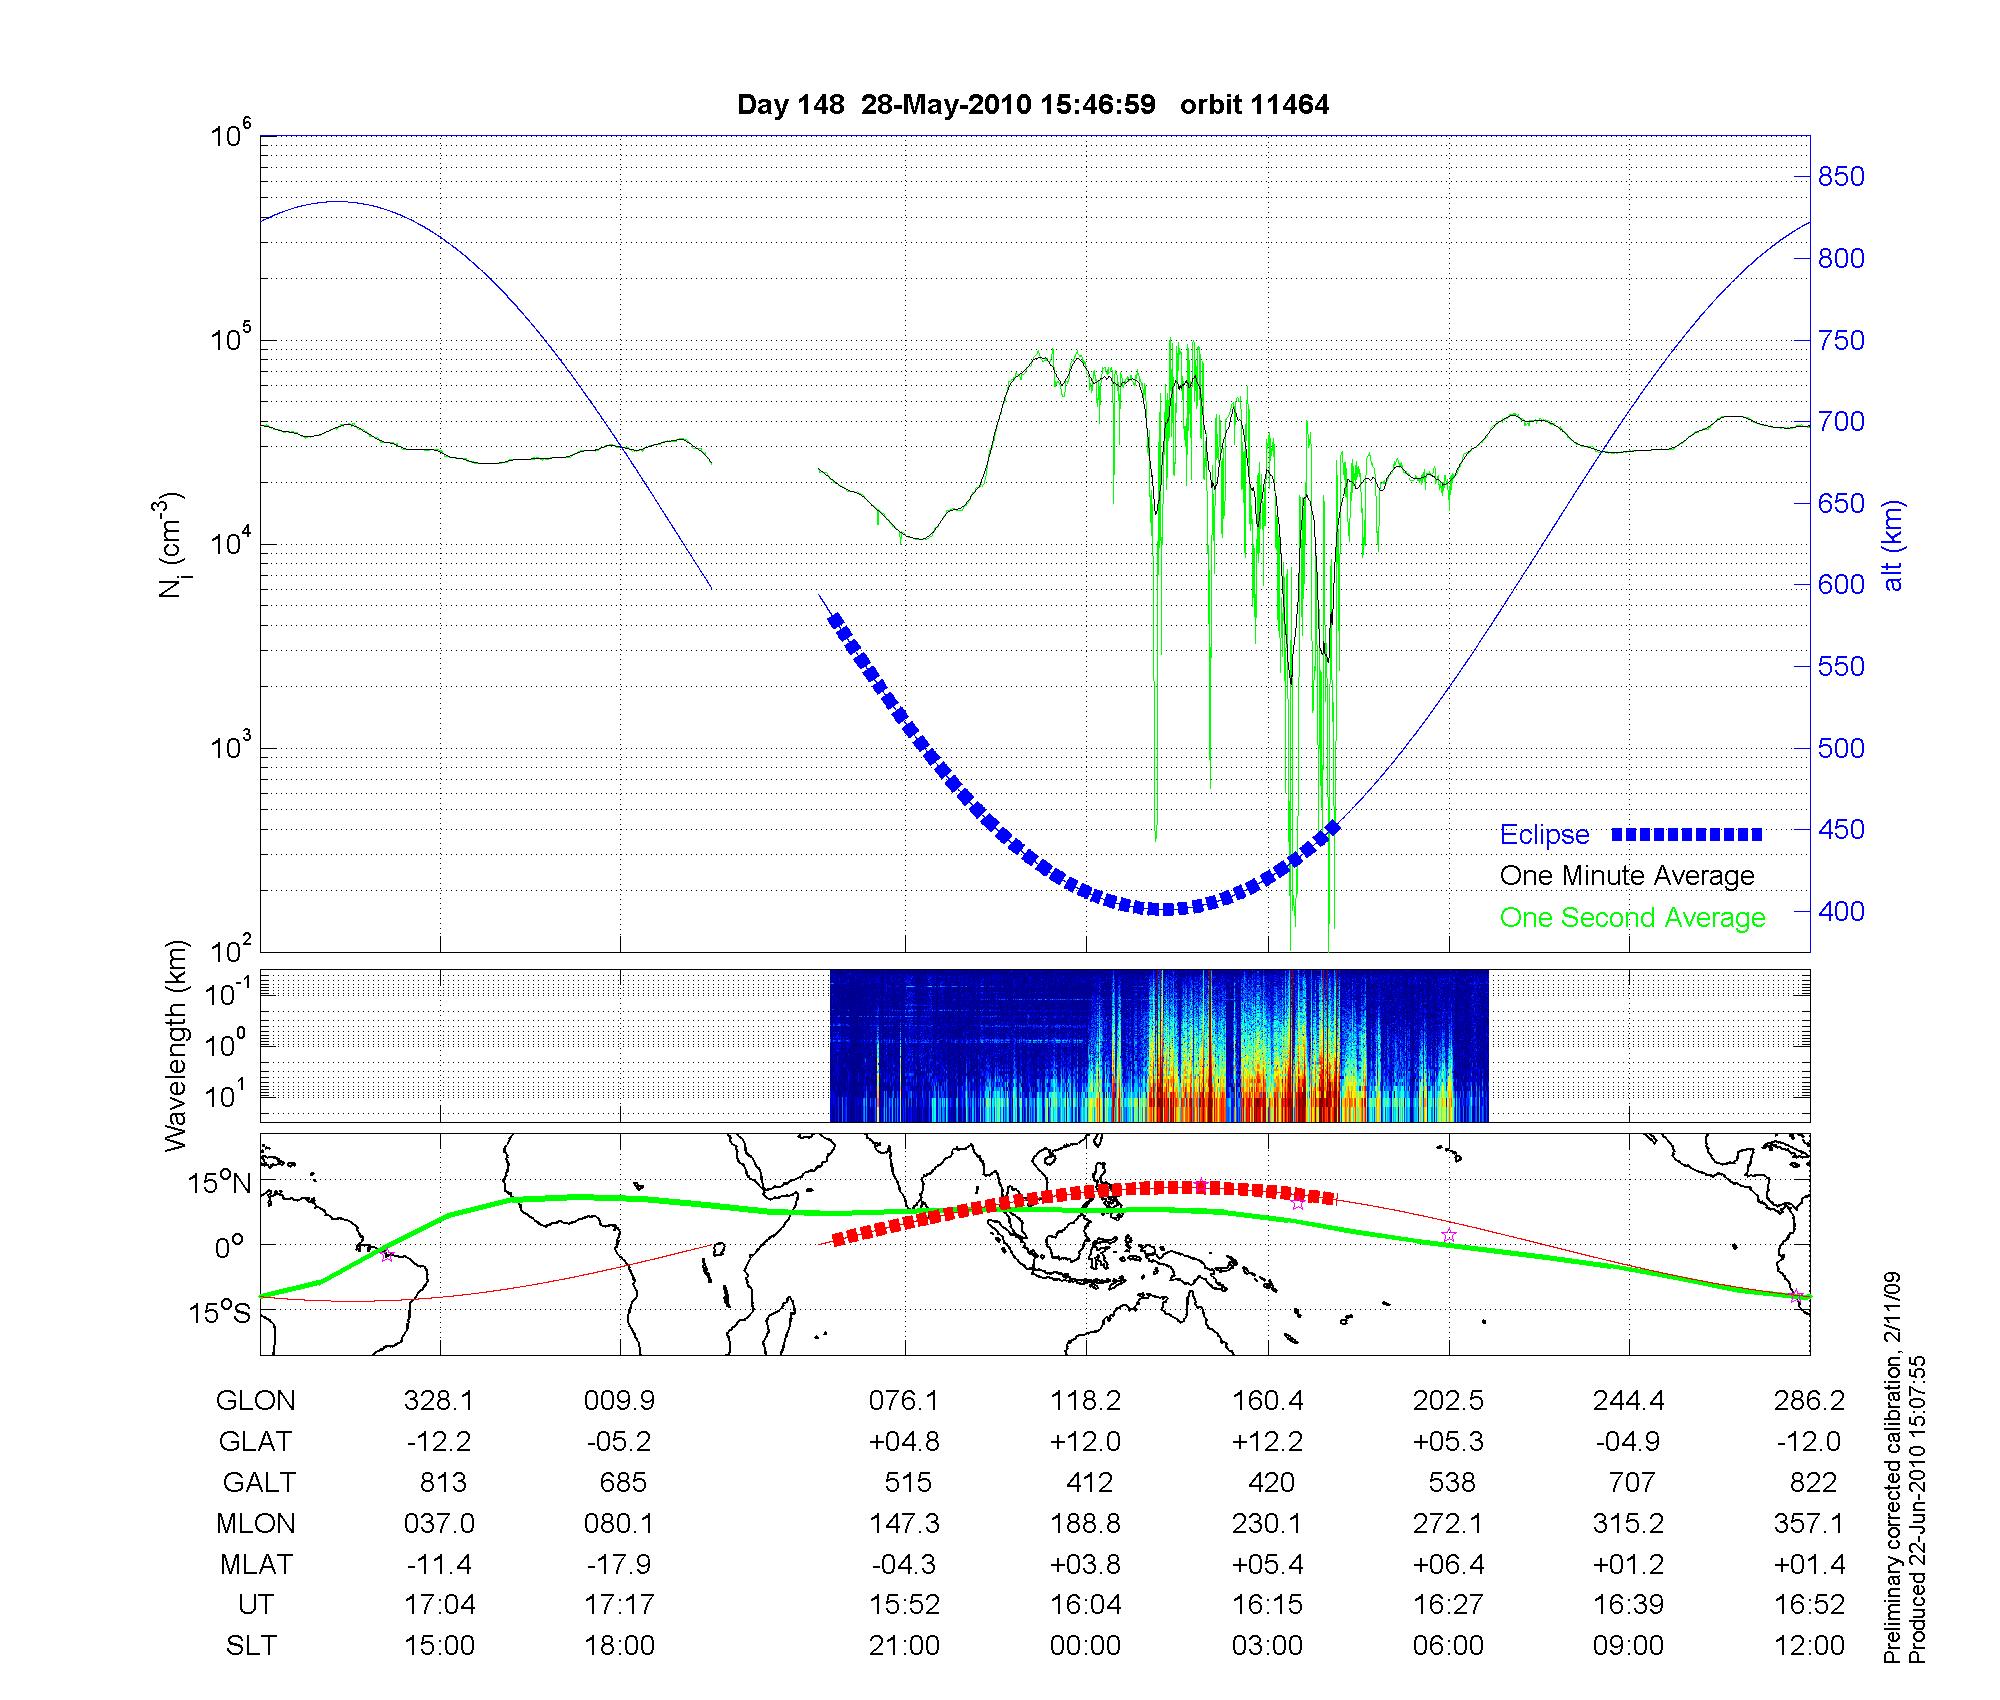
Each figure represents one orbit of data from the PLP instrument. The figure title indicates the day of year, the date, the UT time for the start of the orbit, and the orbit number. The start of an orbit is defined by the northward crossing of the geographic equator. The oldest data in a plot starts at the northward crossing of the equator and not necessarily at the left of the plot.
Click figure to embiggen.
The plot abscissa has tick marks for geographic longitude,geographic latitude, altitude, magnetic longitude, magnetic latitude, Universal time, and solar local time. The graph's tickmarks are orginized by solar local time. Ticks will always be at 1500, 1800, 2100, 0000, 0300, 0600, 0900 and 1200 SLT. The graph is centered on 0000 SLT because the primary focus of the C/NOFS mission is on the nighttime ionosphere.
Each figure contains 3 subplots (top, middle and bottom). The top plot displays the one minute average ion density measured by the PLP Ion Trap (black trace), the 1 second average ion density measured by the PLP Ion Trap (green trace), and the altitude of the C/NOFS spacecraft (blue trace). The ion density ordinate is on the left side of the plot and the altitude is on the right side of the plot. Horizontal gridlines correspond to ion density. The heavy dashed blue trace indicates that the spacecraft was in eclipse.
The middle plot contains a spectragram of the relative power of the log of the ion density fluctuations as a function of wavelength. This plot is for indication use only and is not calibrated in any meaningful way. This plot is mainly of use to individuals who are interested in requesting data at the 512 Hz sample rate. While the color scale of the fft is arbitrary, it is consistent between figures. This fft of delta_n/n is only available when the PLP sample rate is at 256, 512 or 1024 Hz. PLP typically cycles between a 32 Hz daytime sample rate and a 512 Hz eclipse sample rate. Currently, PLP also operates at 512 Hz for either 10 minutes before or after eclipse exit.
The bottom plot shows a map of the globe along with the C/NOFS ground track (red), the approximate magnetic equator (green), and various point of interest (purple stars). The heavy dashed red line indicates where the satellite was in eclipse. The points of interest currently are Guam, Kwaj, Christmas Island, Jicamarca, and Sao Luis.
Each figure has information about what cal was used to make it and when the figure was actually produced. Right now (as of 4/23/09) the latest and greatest cal is the Feb 11th cal.
The break in the trace: The break in the data traces is frequently commented on and often misunderstood. The break does not represent any loss of data, it is a product of the plotting methodology. Each plot contains one orbit of data. The start and stop of an orbit is defined by the northward crossing of the geographic equator. As the Earth rotates during an orbit, C/NOFS crosses the equator farther west each orbit: this is where the break comes from. The plot for the next orbit will contain the data that appears to be missing in the break.
Known Bugs, etc: There is a bug in my graphing routine that often puts a momentary drop in the 1 sec denisty (green) when PLP switches from 512 Hz to 32 Hz mode. If you see an isolated blip right where the spectragram ends, that's the bug. The bug was fixed at some point in 2010 but old figures have not been reprocessed.
Torque rods: The figure above of orbit 11464 contains artifacts produced by the firing of the C/NOFS torque rods (click figure for larger image). The two blips in the fft plot just before 15:52 UT are due to torque rod firings. Due to the nature of the satellite state of health files, it is difficult to remove all the torque rod artifacts. The firings usually appear in pairs (as seen here) and are very short in duration.
PLP raw data
PLP data at 1 Hz is available to the community upon request. Contact me at roddy.patrick[at]yahoo.com to get access.
The dataset should be kept relatively up to date. Feel free to contact me if data you need is missing.
Data at higher sample rates (up to 512 Hz) for short time periods is available upon request.